Redux DevTools, Outside the Browser
An in-app debug drawer, a desktop monitor with time travel, and a CLI that prints one JSON object per line: three surfaces over one instrumented store.
Redux’s original developer tools were a browser extension, and they were the single best argument for the whole pattern. Every action, in order, with the state before and after and a diff between them, and a slider to travel back through it. People adopted Redux because they saw that timeline.
Kotlin apps don’t run in a browser. The idea was too good to leave there.
The integration is one enhancer
implementation("org.reduxkotlin:redux-kotlin-devtools-core:1.0.0-alpha04")val store = createConcurrentStore( reducer, initialState, enhancer = devTools(DevToolsConfig(name = "MyApp")),)That’s the whole thing, and it goes in the same enhancer parameter you use for middleware. Every action, its resulting state, and a computed diff now flow into a session.
One design rule I held to throughout: DevTools instrumentation can never break the host store. Every path inside the enhancer is wrapped: a serializer that throws, a listener that explodes, a monitor that disappears mid-session. All of it is caught and routed to a logger, so your app never crashes because its debug tooling had a bad day.
Surface 1: the in-app drawer
Wrap your app, get a floating bubble and an edge swipe:
implementation("org.reduxkotlin:redux-kotlin-devtools-inapp:1.0.0-alpha04")ReduxDevToolsHost(InAppConfig()) { App()}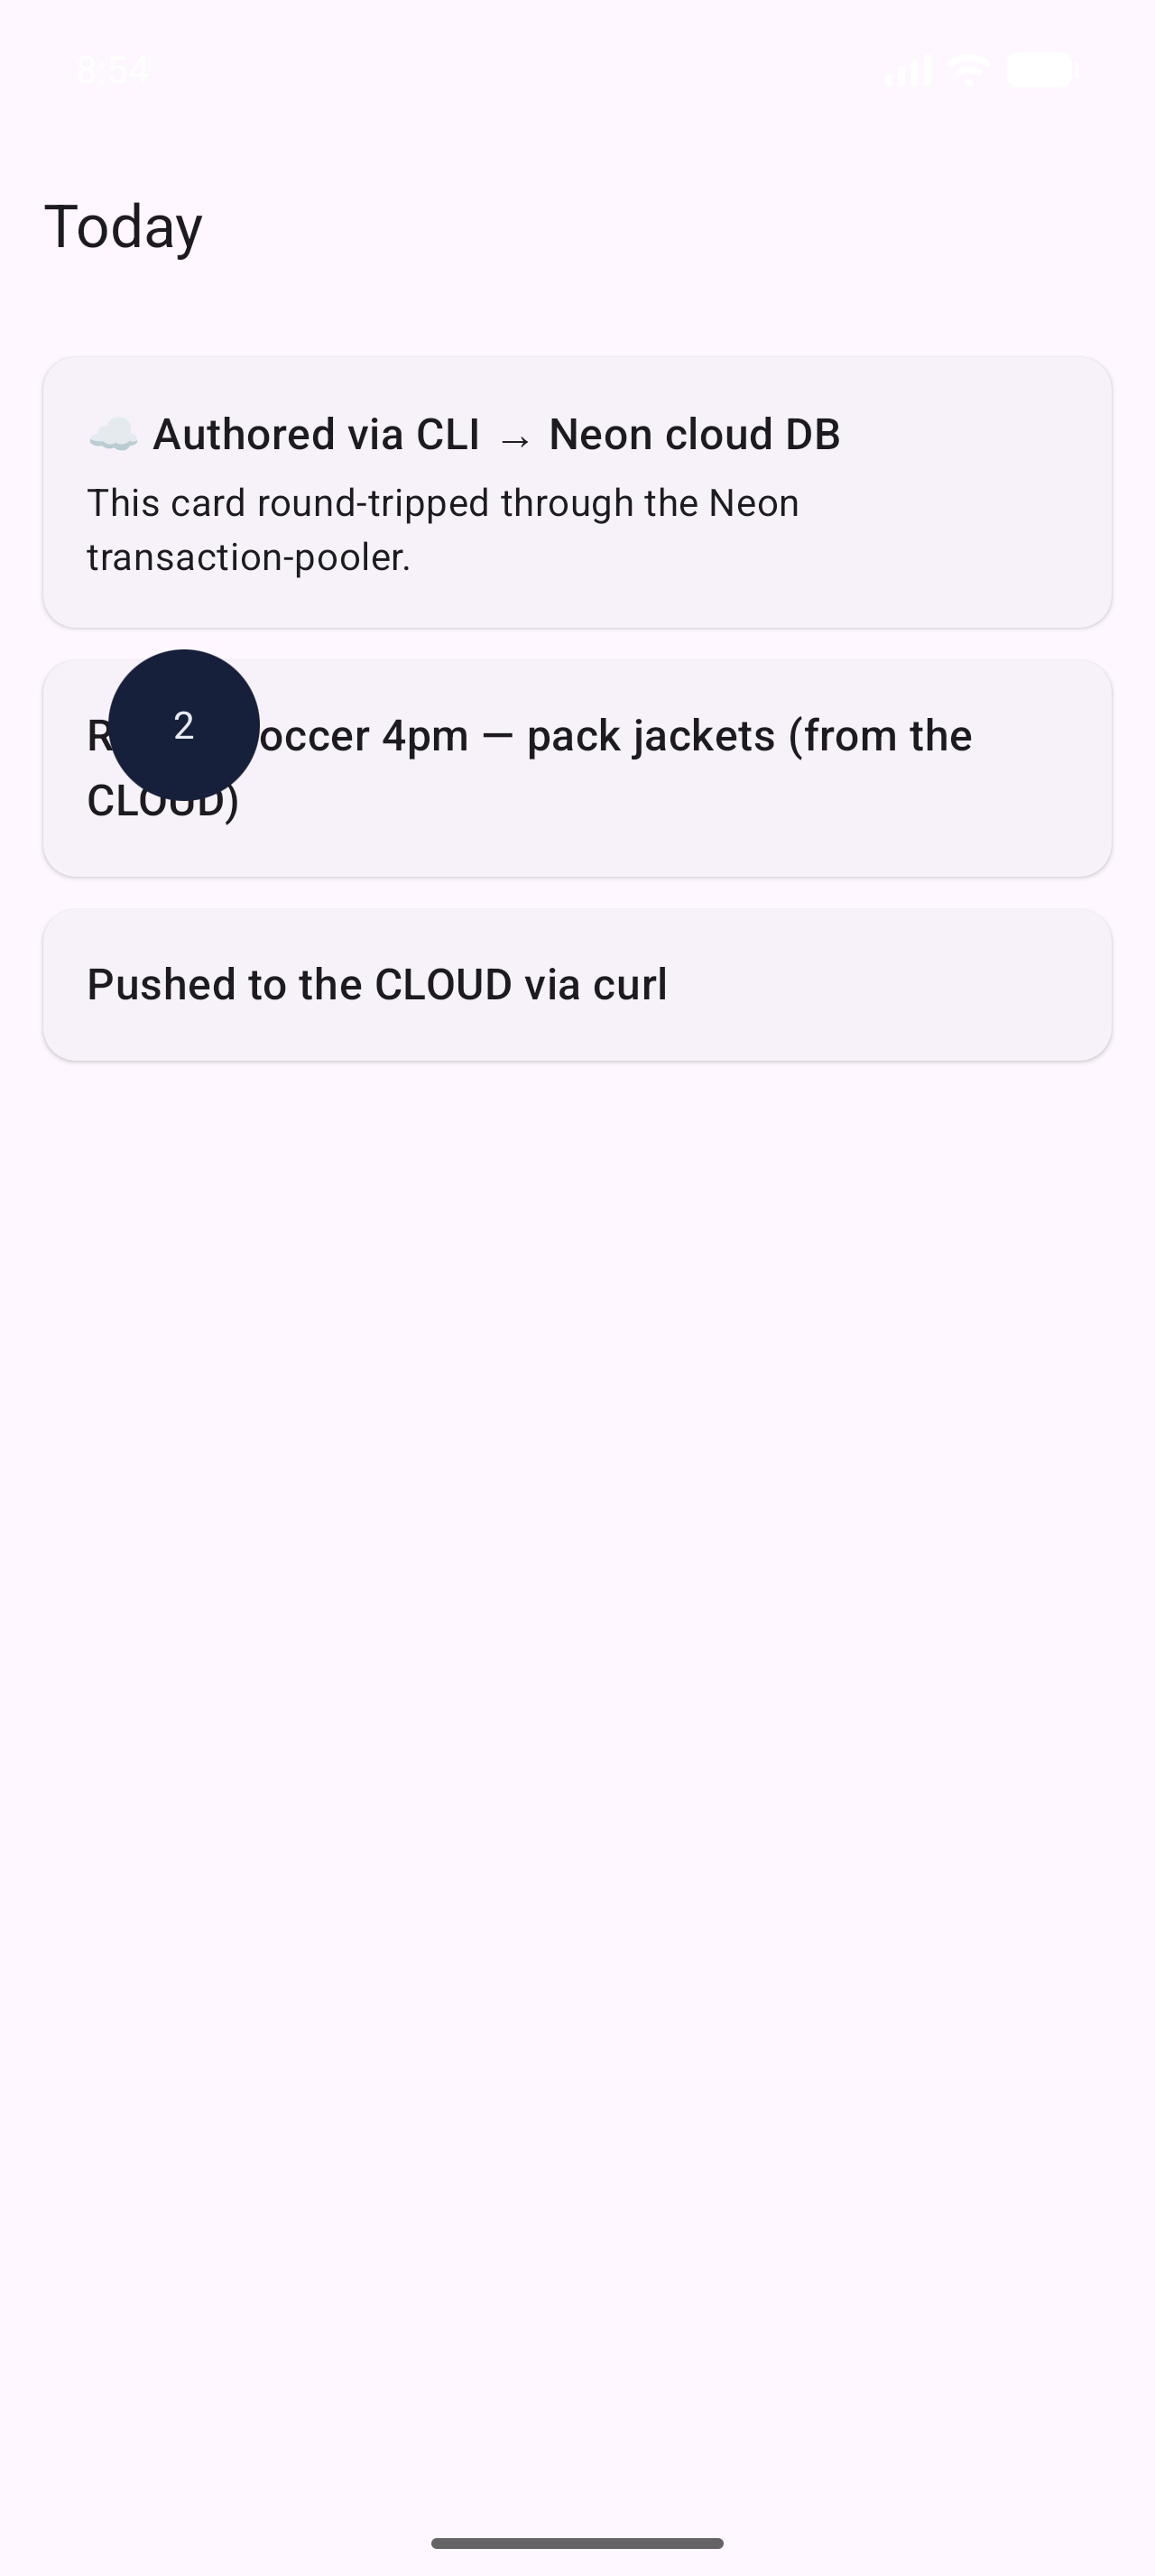
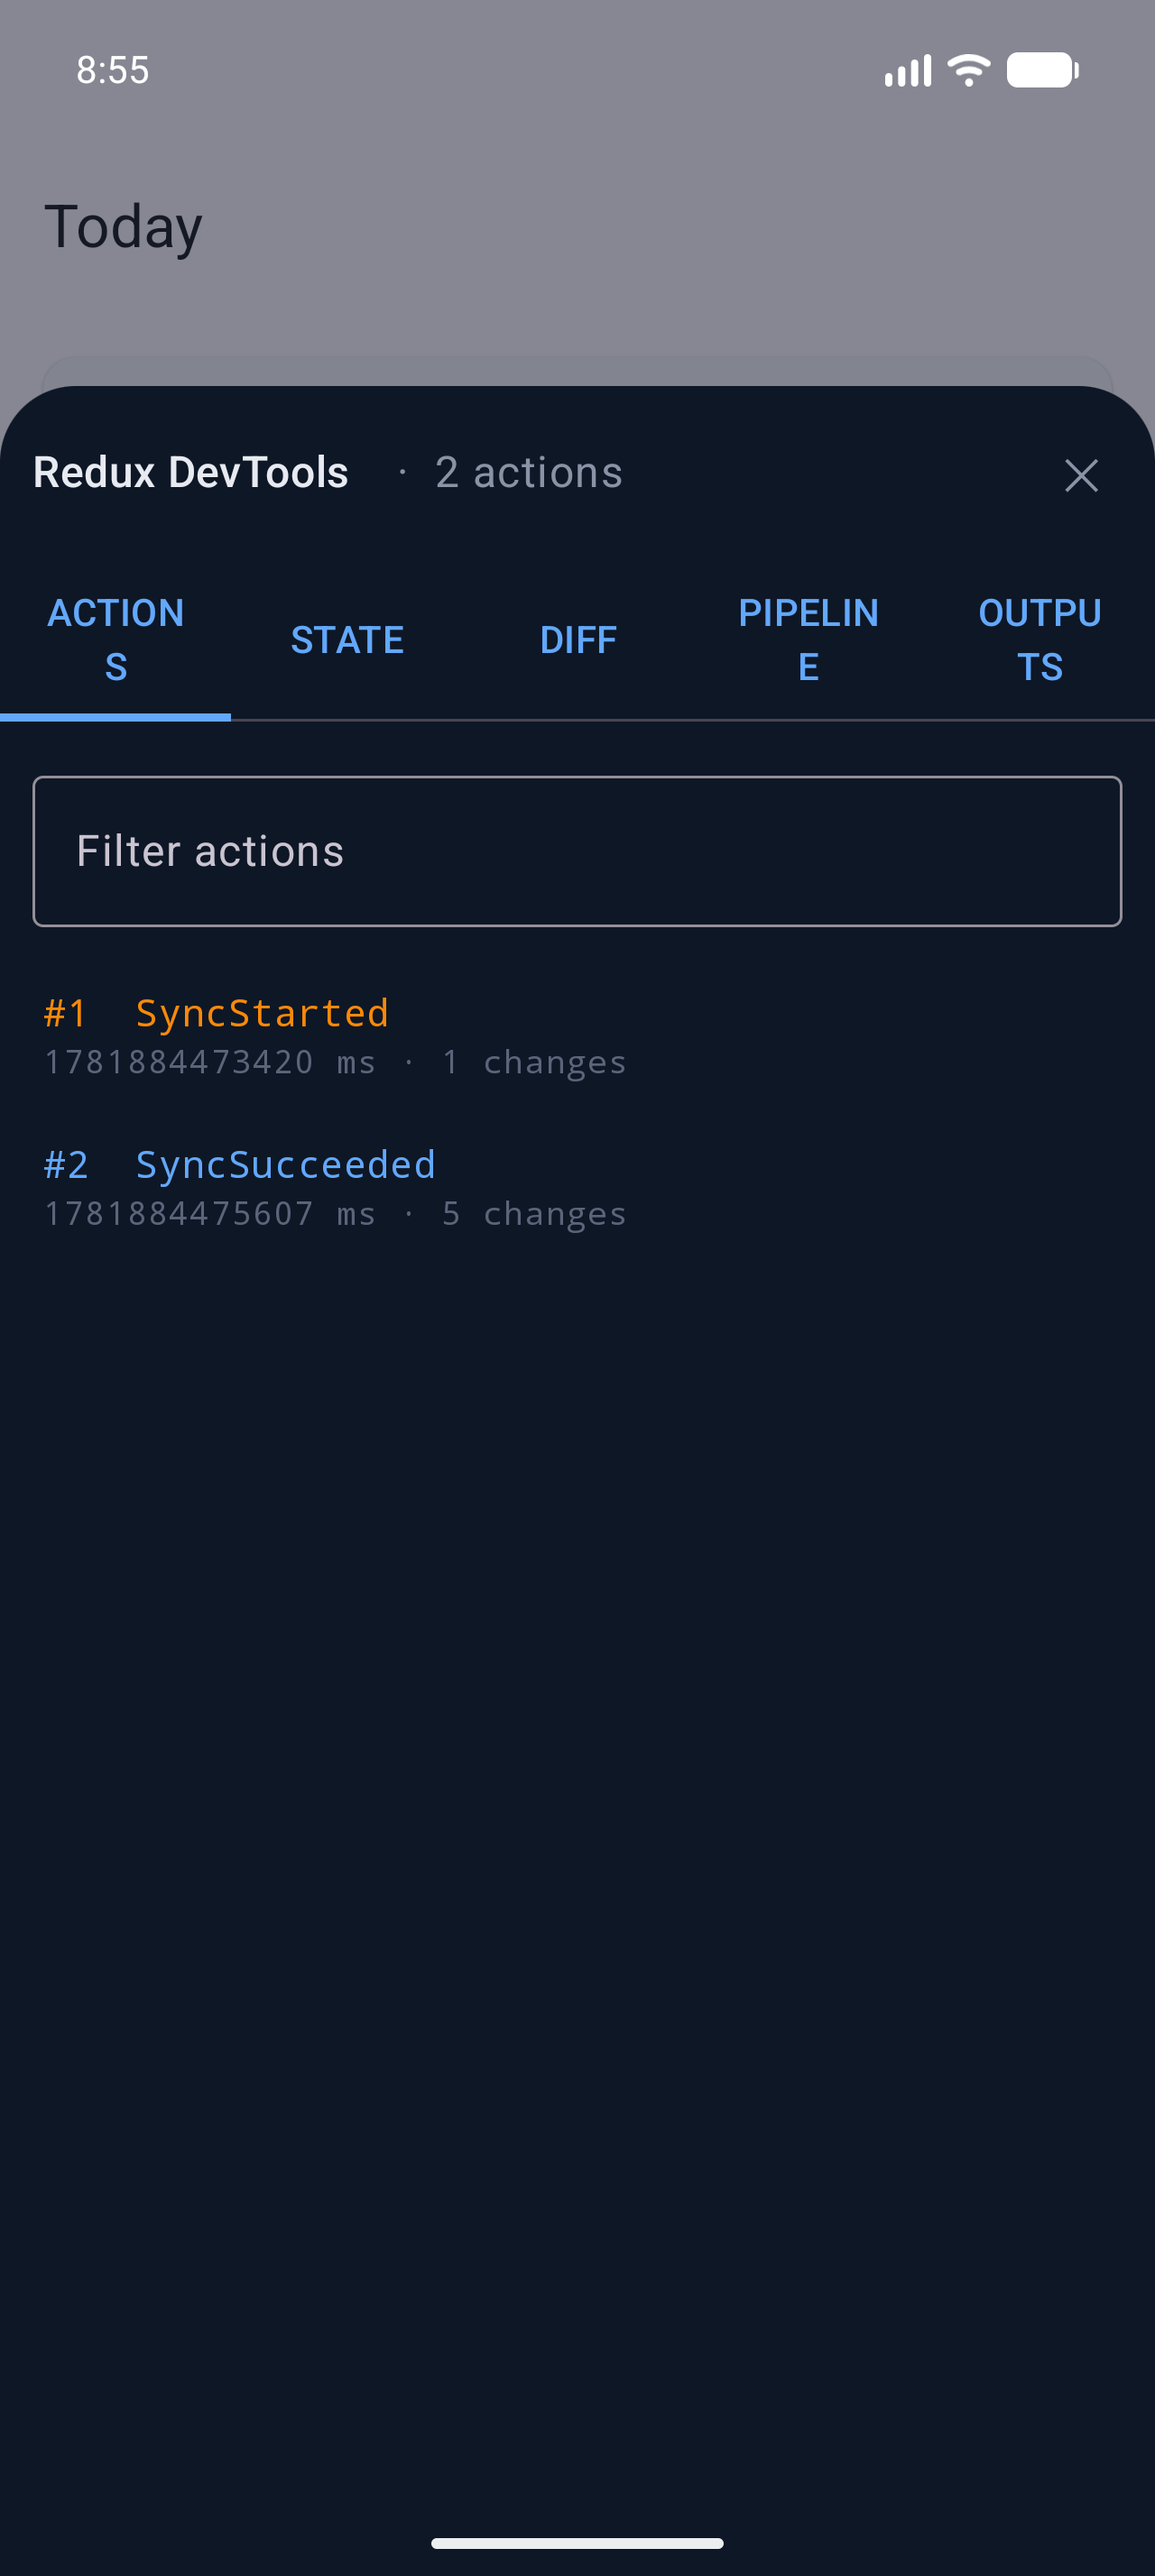
Five tabs: Actions, State, Diff, Pipeline, Outputs. It renders inside your own Compose tree, which means no SYSTEM_ALERT_WINDOW permission and no system overlay, and which also means it’s only there while your app is foregrounded. Fair trade.
New in alpha03 is ReduxDevToolsPanel: the inspector body with none of the drawer chrome (no bubble, no scrim) so you can drop it into a tab of a debug drawer you already have.
@Composablepublic fun ReduxDevToolsPanel( instanceId: String? = null, startTab: DevToolsTab = DevToolsTab.ACTIONS, theme: DevToolsThemeMode = DevToolsThemeMode.DARK,)I built this because I wanted it in my own app, which has a house debug drawer full of unrelated tools. Redux DevTools is now just one plugin in it.
Surface 2: the desktop monitor
The drawer is on a phone screen, which is a rough place to read a state tree. The desktop monitor is where I actually debug.
rk devtools serve --uiYour app streams to it over a WebSocket bridge:
implementation("org.reduxkotlin:redux-kotlin-devtools-bridge:1.0.0-alpha04")DevToolsHub.session("MyApp")?.let { session -> BridgeOutput(BridgeConfig(clientId = "myapp", clientLabel = "My App")).start(session)}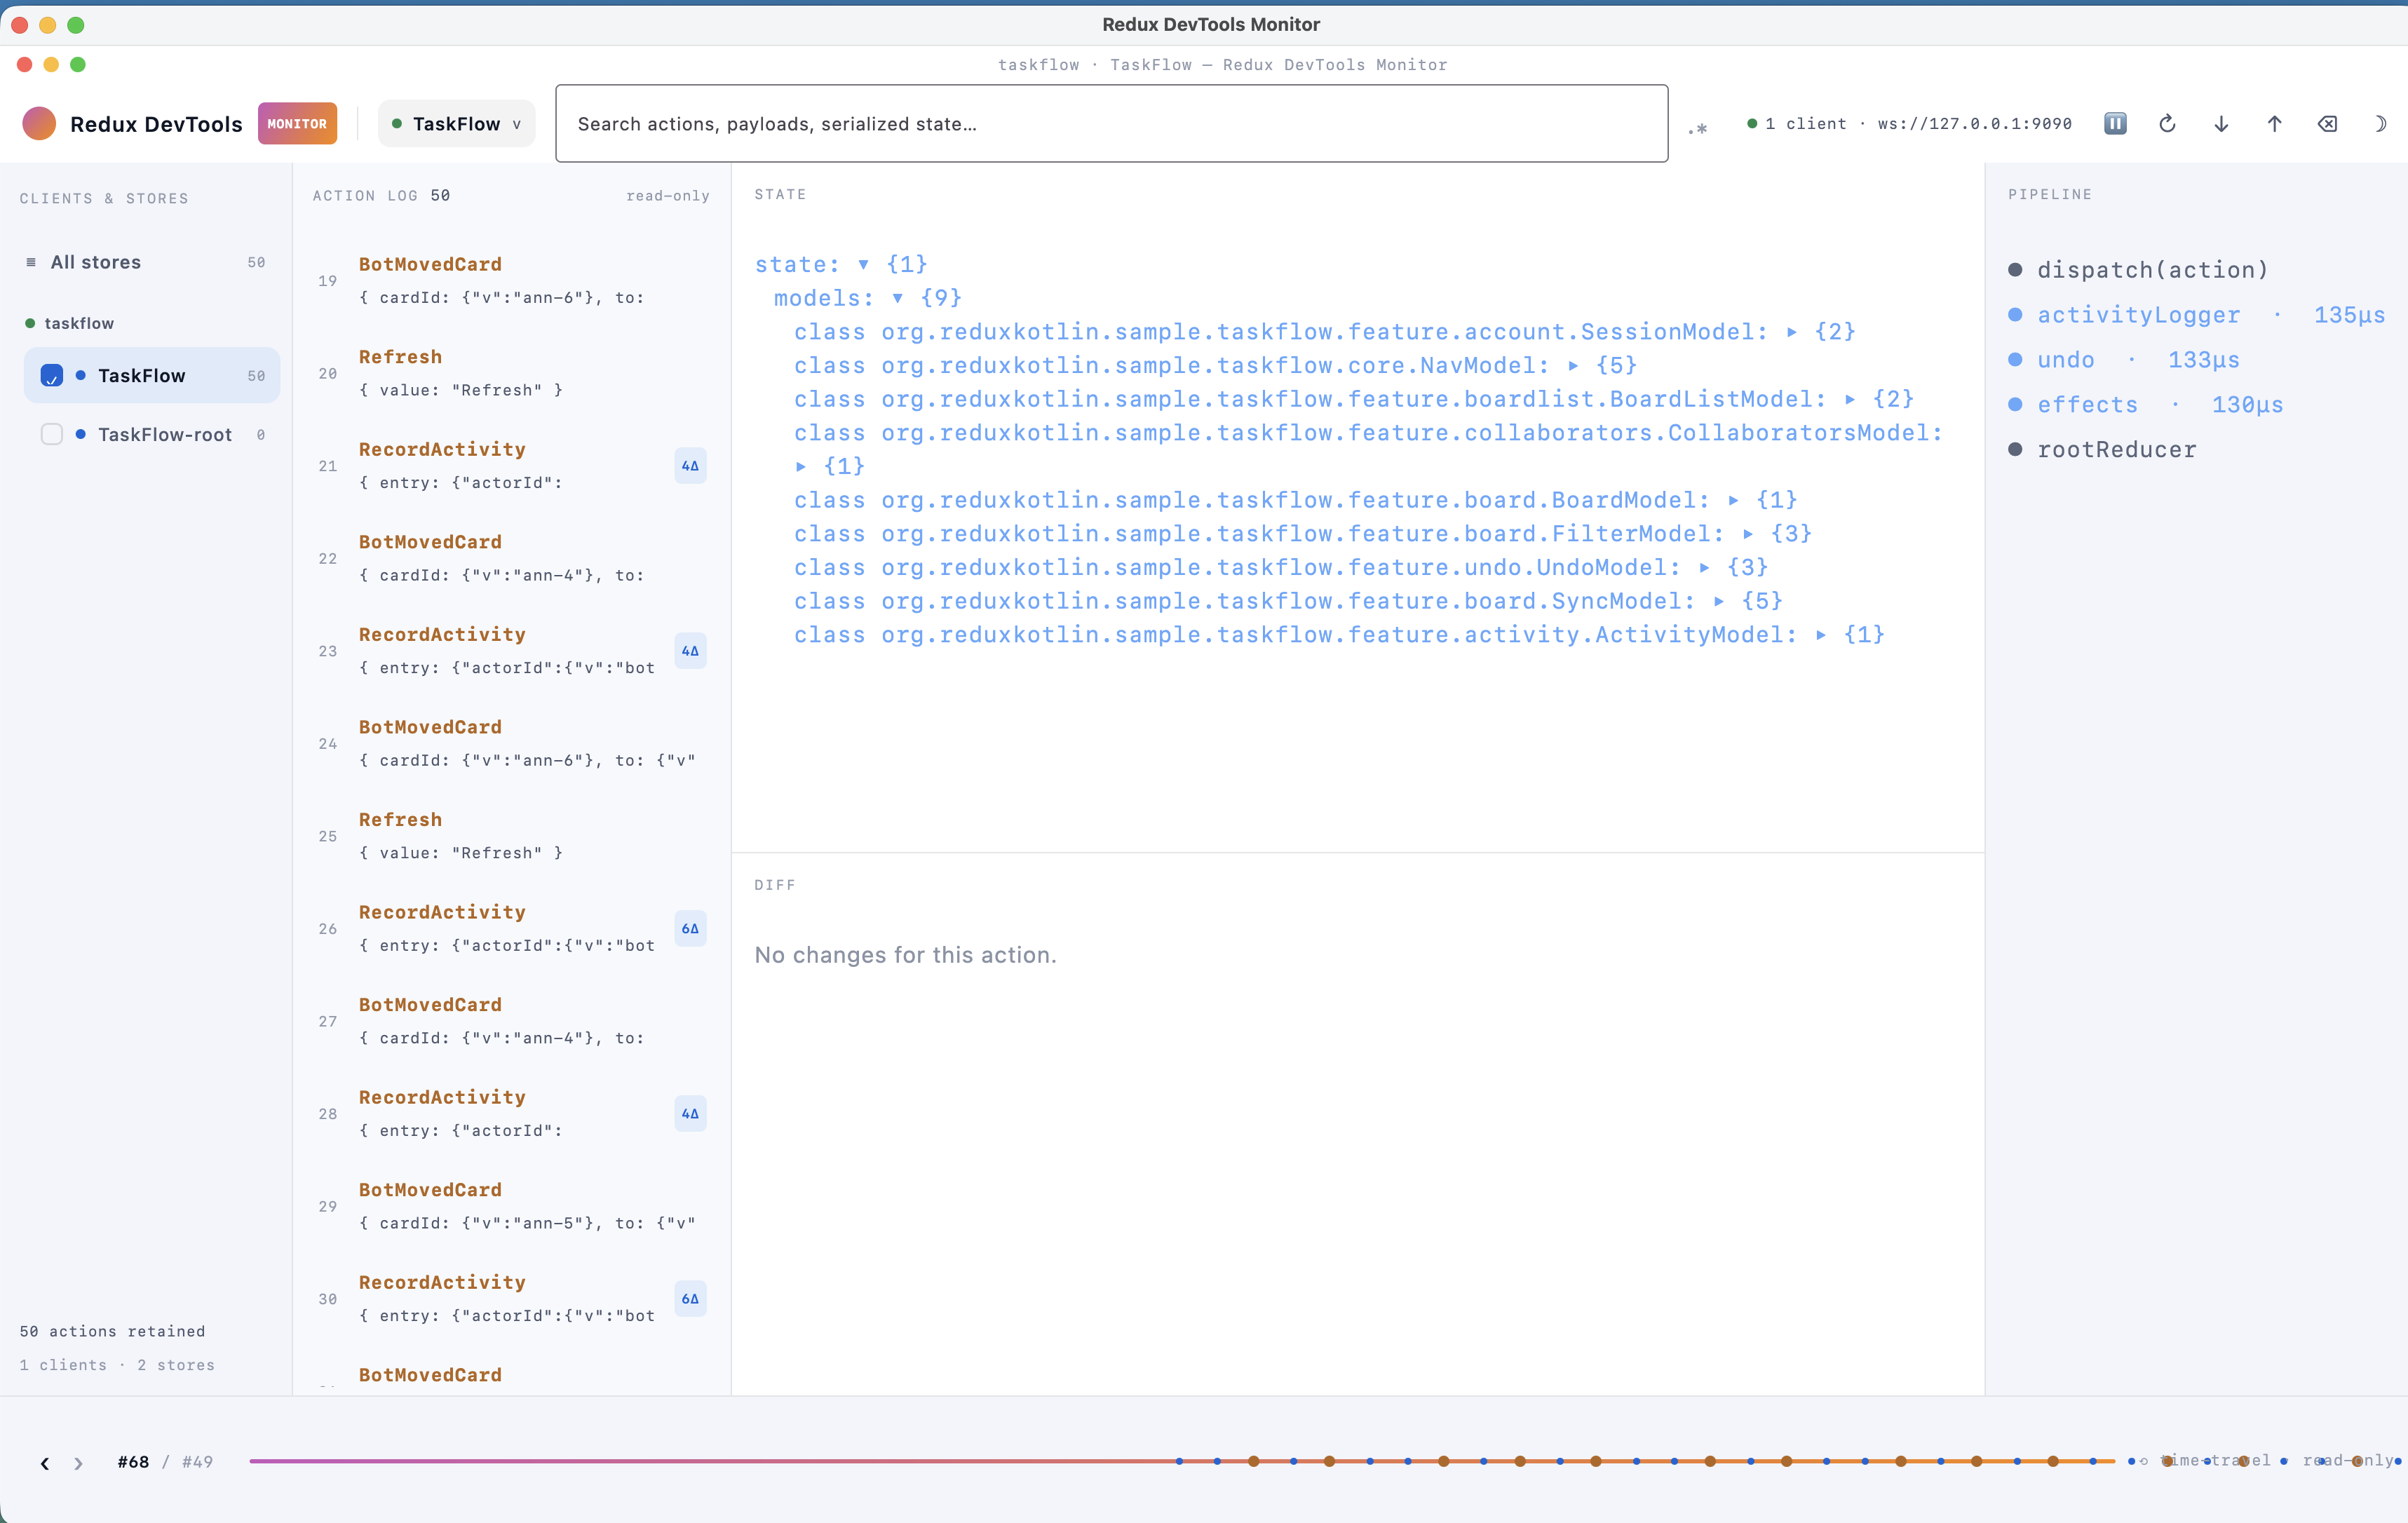
Four panels at once (store rail, action log, state/diff, pipeline) instead of the drawer’s five tabs, plus a time-travel timeline, global regex search, pause, and save/load of recorded sessions as .jsonl. It binds loopback by default; going off-loopback requires an explicit host and a shared token, checked against the connecting peer.
A few things in that screenshot are worth pointing at, because they’re the reason I use this surface and not the drawer:
- The store rail lists both of TaskFlow’s stores, because it runs a root store plus one per account. You can watch one, or merge them into a single timeline ordered by time.
- The action log puts a change count next to each action (
4Δ,6Δ), so you can see which actions actually did something before you click any of them. - The pipeline panel times every middleware:
activityLogger 135µs,undo 133µs,effects 130µs, thenrootReducer. When a dispatch feels slow, that column tells you which middleware ate it, without you instrumenting anything. 50 actions retainedisDevToolsConfig.maxAgedoing its job. It’s a ring buffer, not an unbounded log, so leaving the monitor attached to a long session doesn’t eat memory forever.
This is the surface I recommend. It’s also the only one that works for a headless, native, or server-side app, where there’s no Compose tree to draw a drawer into.
One bug to know about: in the current
alpha04Homebrew build,rk devtools serve --uifails to launch the GUI because the bundled jlink runtime is missing a library AWT needs. The bridge itself serves fine. Until it’s fixed, run the monitor from source with./gradlew :redux-kotlin-devtools-standalone:run. I found this while writing this post.
Surface 3: the command line
Same session, same events, printed as text. That turns out to matter enormously, and not only for humans.
rk devtools serve # captures stream into .rk-devtools/# ...reproduce the bug in the app...rk devtools stores # myapp::MyApprk devtools actions --last 30rk devtools diff --type '*Failed*' --last 5rk devtools state --at 42rk devtools tail --followSix subcommands: serve, stores, actions, diff, state, tail. They share a set of filters: --store, --type (a glob), --last N, --since/--until (action IDs), --since-time/--until-time (timestamps), --pretty.
The design detail I’m proudest of is --format, which has three strictly nested tiers:
actions → { actionId, type, store, ts }diff → + diff: [ { path, before, after } … ]full → + state: { … the entire store snapshot … }Output is one JSON object per line, and you pay for exactly the context you asked for. Scanning what happened costs four fields per action. Investigating one suspicious action costs its changed paths. Reconstructing the world at a single point costs the whole tree, and you only pay that when you actually need it.
I designed those tiers with coding agents in mind, and then found I use them constantly myself. rk devtools actions --last 30 is a much better first question than “let me dump the state and read it.”
The original extension still works
redux-kotlin-devtools-remote speaks the SocketCluster/RemoteDev protocol that @redux-devtools/cli and the browser extension’s remote monitor expect, right down to the double-encoded PERFORM_ACTION envelope. Point it at port 8000 and your Kotlin app shows up in the extension you already know.
The limits: the extension gets actions and state. It doesn’t get our diffs (it computes its own) and it doesn’t get the pipeline view at all, because that isn’t in its protocol. It’s a compatibility path and a bit of lineage, not the recommended surface. But there’s something satisfying about an Android app appearing in the Redux DevTools extension, and I wasn’t going to leave it on the table.
Which surface runs where
Worth knowing before you pick one, because this is the one place the nine-target story gets uneven:
- The drawer needs a Compose tree, and it needs
material3, which means it drops the desktop-native targets (linuxX64,mingwX64). - The bridge only needs a WebSocket client, so it compiles everywhere the library does. That’s why the desktop monitor is the only option for a headless, native, or server-side store.
- The CLI is a JVM binary that reads capture files, so it doesn’t care what your app was built for.
The pipeline view
If you name your middleware, the drawer and the monitor can show you which middleware saw which action, in order:
val cfg = DevToolsConfig(name = "MyApp")val enhancer = devToolsMiddleware( cfg, named("activityLogger", activityLoggerMiddleware()), named("undo", undoMiddleware()), named("effects", effectsMiddleware()),)One footgun, which I’ve walked into: colliding session IDs. Sessions are keyed by instanceId ?: name, so two stores that both take the default name will silently interleave into a single timeline. Name them.
Shipping it
redux-kotlin-devtools-inapp-noop mirrors the entire API with empty bodies. Substitute it in your release configuration and the whole thing compiles to nothing:
debugImplementation("org.reduxkotlin:redux-kotlin-devtools-inapp:1.0.0-alpha04")releaseImplementation("org.reduxkotlin:redux-kotlin-devtools-inapp-noop:1.0.0-alpha04")And a warning worth taking seriously: everything recorded is visible in every monitor. If your actions carry auth tokens or PII, they are in the timeline and in the .jsonl captures. Provide a custom ValueSerializer in DevToolsConfig and redact them.
The DevTools family is experimental and exempt from semver until it stabilizes.
Full details in the DevTools doc and the CLI tutorial.
Happy debugging, whether the eyes on that timeline are yours or your agent’s.
Sources of truth: reduxkotlin.org · github.com/reduxkotlin/redux-kotlin · the TaskFlow sample
Part 7 of ReduxKotlin 1.0.